

Gross Domestic Product of the Regions of Thailand (Gross Regional Product, GRP)
GDP in the Regions of Thailand (Gross Regional Product, GRP)
Data for 2021 have recently become available (numbers below updated from data available in December 2023).
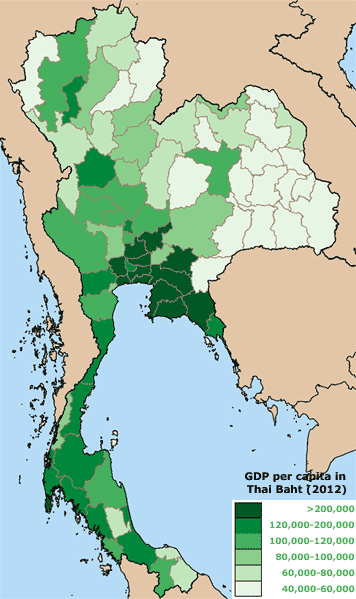
What is even more interesting than the GDP figures for the whole of Thailand, are the data for the different regions and provinces of the country. As before, the latest data provided (for 2020, as provided by the Office of the National Economic and Social Development Council, NESDC), show that there are great differences in Gross Domestic Product (GDP) per capita between the different regions and provinces..
The Gross 'Provincial' Product in the Northeast (Isaan) and to a lesser extent in the North, is substantially lower than in Bangkok, the Central and the Eastern Region. The Gross Provincial Product of the Southern and Western Regions is situated in between.
GDP in Bangkok and surrounding provinces is 5 times bigger than in the poorest (and most populated) Isaan Region of Thailand. Note also that the Eastern Region (with lots of heavy industry) in 2023 has a higher GDP than Bangkok and Vicinity area. This is a reversal from the year before, but actually continues a previous trend of being the 'richest' region of the country.
Note that the data provided here are expressed in Thai Baht and indicate real GDP.
2020 was a bad year for the Thai (and the World) economy. Overall GDP decreased by 7.7 %. The Regions of Thailand, except for the Northeast (the poorest region, +0.1 % growth), all showed negative growth rates : North (-5 %), South (-12.7%), East (-13 %), West (-4.6%), Central (-2.9%), Bangkok & Vicinities (-8.4%). Overall GDP decrease was later adjusted to -6.2 % by NESDC
2021 saw a mild improvement in GDP for the whole of Thailand with an increase in GDP of 1.5 %. Except for the Southern Region, the numbers improved from the previous year in the rest of Thailand. Improvement was most pronounced in the industrial Eastern Region (+ 7.7 %).
 |
|
|||||||||||||||||||||||||||||||||||
|
||||||||||||||||||||||||||||||||||||
The figure below shows :
Regional GDP (GRP) is higher than the average for Thailand in the Eastern Region, Bangkok and Vicinity, and the Central Region. It may surprise some that GDP in the Eastern Region (where heavy industry is located), surpassed GDP in Bangkok and Vicinity, as early as around 2006. The figure shows a profound drop for almost all regions between 2018 and 2020, related to the Covid-19 pandemic.
GDP is lower in the Southern and Western Region, and much lower in the Northeast and North of the country. For location of regions in Thailand, look : Provincial GDP in Thailand.
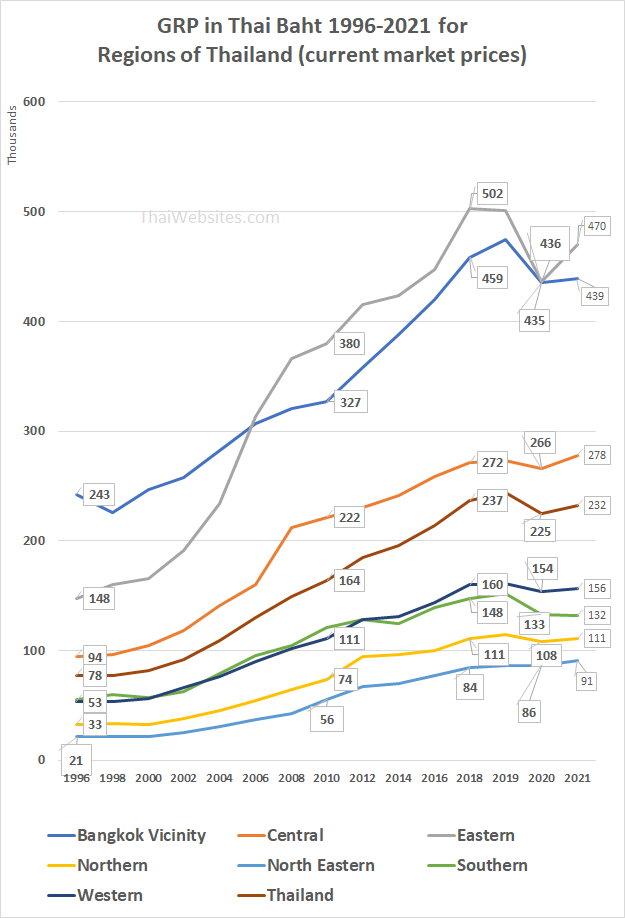
GDP growth in Thai baht from 1996 to 2021 for different regions of Thailand (latest data published 2023).
Source of Data : NESDC (National Economic and Social Development Council)
The static latest GDP numbers of course do not reveal recent trends in income across Thailand. When looking at the data as provided by NESDC for the period between 1996 and 2021, it is clear that there is a pronounced difference in GDP growth rate between Bangkok (and its surrounding provinces) and the other regions of Thailand.
While the Northeast and the North of the country still have an enormous way to go, growth of GDP development is promising. For all his faults, the policies of the Thaksin Shinawatra governments between 2001 and 2006 (universal health care, a farm debt moratorium, village microcredit programs, entrepreneurial programs and rice price pledging schemes) may have been beneficial.
Figure below : Growth is significantly higher in the Northeastern and Northern Region, while continuing in the Eastern Region (heavy industry, petrochemical industry). The growth of GDP in the Bangkok area is significantly lower than the average for Thailand.
Partly these trends can also be explained by demographic changes. The population of Bangkok and its vicinities has increased dramatically over the last decade, while the population especially in the Northeast has decreased. Likely a lot of 'low-wage' migration has occurred from the poorest provinces towards Bangkok, and surrounding provinces.
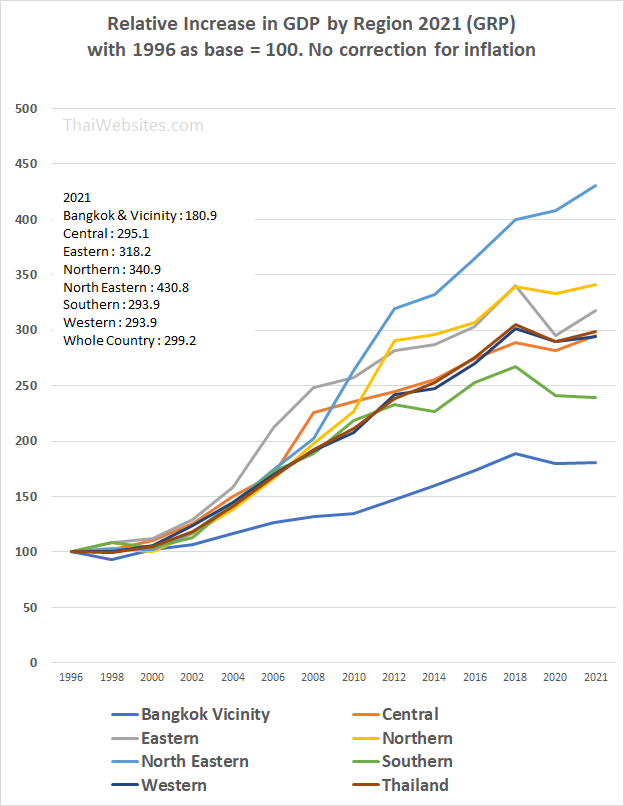
GDP growth rates in different regions of Thailand (1996 GDP set to =100).
Current market prices GDP growth is used, so the absolute numbers (not corrected for inflation)
are not that useful. Just compare the trends in different regions, with Bangkok showing the slowest growth.
The number of people working in the agricultural sector, to a large extent, explains the low GDP in the northern and northeastern region of Thailand.
Needless to say, the income disparity, though improving, that presently exists, will continue to remain for some time and has negative social and political effects. Whatever side one chooses, the social and political upheaval over the 10 years or so prior to the 2014 military coup in Thailand, can be related to an 'awakening of the masses'. A new government came to power in 2023, and seems to committed to increase growth in the country.
More Data : GDP of Provinces of Thailand