

Car and Motorcycle Production and Sales
Updated : June 2020
Below you can notice that total domestic sales of cars, including passengers cars had picket up a bit during 2018 and 2019, after a few years of lesser sales. 2020 will be different with the Corona virus having effects on the local economy and the world economy. Vehicle exports seem to hover between 1 million and 1.2 million units for quite a few years now.
When looking at total local sales and passenger cars sales, you can see that more pick-up trucks are actually sold than passenger cars, suggesting that most cars are used for work-related activities, not just commuter traffic.
Source : Thailand Automotive Institute
| Year : | Domestic Wholesale : (total Passenger Cars) |
Vehicle Exports : |
| 1993 | 438,634 (174,228) | |
| 1994 | 462,884 (155,670) | |
| 1995 | 547,758 (163,371) | |
| 1996 | 561,523 (172,730) | 14,020 |
| 1997 | 349,033 (132,060) | 42,218 |
| 1998 | 140,402 (44,235) | 67,857 |
| 1999 | 218,330 (66,858) | 125,702 |
| 2000 | 262,189 (83,106) | 152,835 |
| 2001 | 297,052 (104,502) | 175,299 |
| 2002 | 409,262 (126,253) | 181,471 |
| 2003 | 533,176 (179,005) | 235,122 |
| 2004 | 628,265 (209,110) | 332,053 |
| 2005 | 703,261 (188,211) | 440,705 |
| 2006 | 682,163 (195,458) | 538,966 |
| 2007 | 631,251 (182,767) | 690,100 |
| 2008 | 614,078 (238,990) | 775,652 |
| 2009 | 548,871 (238,773) | 535,596 |
| 2010 | 786,096 (362,561) | 896,065 |
| 2011 | 796,123 (377,621) | 735,627 |
| 2012 | 1,434,752 (683,306) | 1,020,259 |
| 2013 | 1,330,680 (656,412) | 1,119,205 |
| 2014 | 881.883(411,413) | 1,128,102 |
| 2015 | 799,632(359,111) | 1,204,895 |
| 2016 | 770,423(329,214) | 1,188,515 |
| 2017 | 871,650(346,250) | 1,139,696 |
| 2018 | 1,041,739(511,963) | 1,140,969 |
| 2019 | 1,007,552(468,638) | 1,054,103 |
| 2020 |
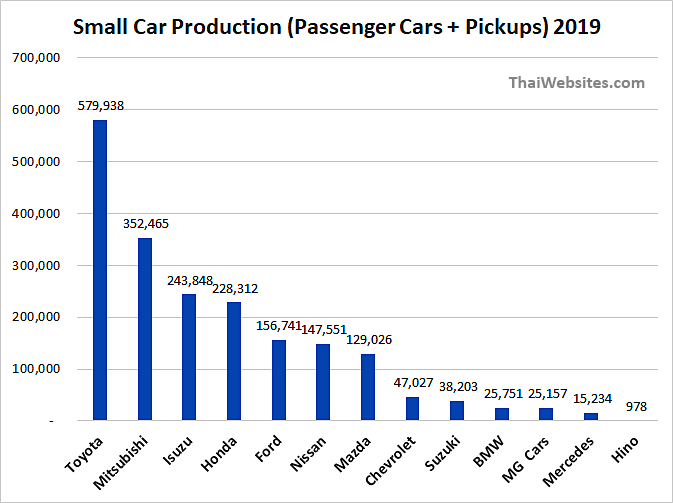
Production of passenger cars and pick-up trucks in Thailand by brand in 2019. It is clear that Japanese brands are most sold in the country.
General Motors will leave the Thai market in 2020, and thus also Chevrolet.
See also : Cars, Pick-up Trucks, Motorcycles sold in 2019 (last complete year) in Thailand.
Motorcycle Domestic Sales and Exports. |
|||
| Year | Total Local Production : | Local Sales : | Exports : (CBU &CKD) |
| 1993 | 1,009,565 | ||
| 1994 | 1,276,630 | ||
| 1995 | 1,464,970 | ||
| 1996 | 1,437,794 | 1,236,159 | 177,635 |
| 1997 | 1,081,044 | 910,664 | 137,055 |
| 1998 | 600,497 | 526,845 | 244,546 |
| 1999 | 846,426 | 604,010 | 214,310 |
| 2000 | 1,125,723 | 783,678 | 267,248 |
| 2001 | 1,209,995 | 907,100 | 272,301 |
| 2002 | 1,961,809 | 1,327,675 | 585,320 |
| 2003 | 2,378,491 | 1,766,860 | 604,995 |
| 2004 | 2,867,295 | 2,026,841 | 831,287 |
| 2005 | 2,358,510 | 2,112,426 | 1,337,586 |
| 2006 | 2,079,555 | 2,054,588 | 1,575,393 |
| 2007 | 1,652,773 | 1,598,613 | 1,790,739 |
| 2008 | 1,923,651 | 1,703,376 | 1,252,584 |
| 2009 | 1,635,249 | 1,535,461 | 588,398 |
| 2010 | 2,026,401 | 1,845,997 | 816,427 |
| 2011 | 2,045,017 | 2,007,080 | 1,133,002 |
| 2012 | 2,606,161 | 2,130,041 | 856,935 |
| 2013 | 2,218,625 | 2,004,498 | 935,747 |
| 2014 | 1,842,708 | 1,701,525 | 887,980 |
| 2015 | 1,800,623 | 1,639,085 | 934,994 |
| 2016 | 1,820,358 | 1,738,231 | 924,917 |
| 2017 | 2,055,193 | 1,810,771 | 849,081 |
| 2018 | 2,063,076 | 1,788,323 | 886,275 |
| 2019 | 1,948,480 | 1,718,587 | 948,839 |