
Urban Migration and Demographic Trends in Thailand
Updated 2022, last data available 2020
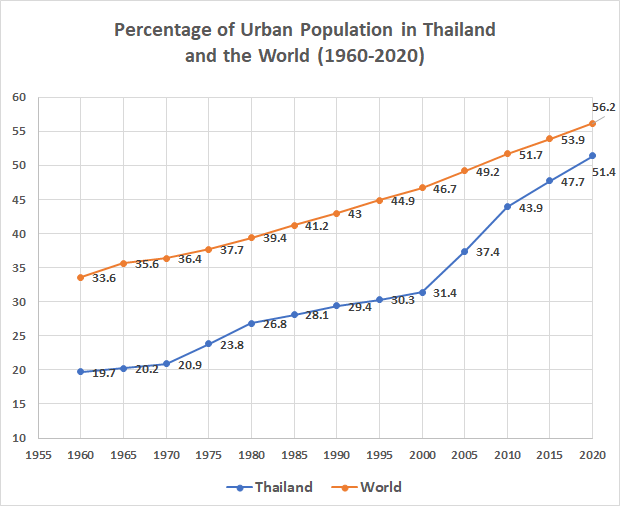
Thailand's urban population as a percentage of the total population remains lower than the world average. Urban population in the world surpassed the 50 % mark a few years ago. Thailand passed the 50 % mark in 2019. [Data provided by World Bank website, reportedly based on Thai data]
Urban population in Thailand was only around 20 % in 1960. Since then there has been a steady increase which accelerated a lot from 2000 onwards. Since then the percentage of city dwellers increased from 31.4 % to 51.4 % in 2020. This is around 1 % of the population moving every year (or around 600,000 people!). We noticed that the trend simply continued during 2020, despite the Covid-19 pandemic. So people kept moving to Bangkok and its vicinity, and the Eastern Region with its industries, despite the fact the GDP decreased substantially in 2020. It looks like when a decision is made, you simply can not go back on it.
Lots of people are moving from the countryside. We must conclude that fewer and fewer people are working in the agricultural sector. Data in graph below provided by World Bank.
When looking at the different regions of Thailand, we can see striking differences. Most prominent and well known locally, is the profound increase in the population of Bangkok and its surrounding provinces (treated as one huge 'metropolis' here). Between 1996 and 2020, the population increased from 9.809 million to 17.095 million, an increase of 74.3 %. The overall population of Thailand increased from 59.595 million to 69.509 million or 16.6 %, (fertility rate in Thailand is around 1.5 % since many years, meaning that the population will start to decrease not long from now).
In absolute numbers the same 24 years saw a prominent decrease in population of the Northeastern Region of Thailand. Isaan saw its population decrease from 20,439 million in 1996 to 18,449 million in 2020, a decrease by 9.7%. Please take into account that Thailand's population overall INCREASED by 16.6% during that period up to 69.509 million people. The population of the Northeast actually increased till the year 2000, so the decrease in population since then is even larger percentage-wise. Looking at the image below, this likely explains a lot about the increase in urban populatoin from the year 2000 onwards.
It is not likely that fertility in the Northeast is much lower than elsewhere in the country. What is more likely is that most of the migrating people ended up in Bangkok and surrounding areas. From the absolute figures it is not quite possible to tell how much of the increase in population of the Eastern Provinces comes from the Northeast, or maybe from Bangkok or other provinces.
.png)
When looking at the increase of the population in the different regions of Thailand, it also becomes clear that there has been a large percentage increase in the population of the Eastern provinces. The population in the Eastern provinces increased from 3.866 million to 6.160 million from 1996 to 2020, an increase of 59.3 percent.
There is a steady increase in population in Bangkok and surrounding area, and in the Eastern Provinces.
The other regions of Thailand seem to be closer to the country average, though it is worthwhile to notice the decrease over the last 15 years of the population in the Northern Provinces.
These migration patterns are most easily explained by the 'follow the money' principle. The Eastern Region is an area of heavy (petrochemical and other) industry, and Bangkok is kind of a center of all things going on in Thailand, except perhaps for the agricultural industry.
Things are clearer from the graph showing the migration pattern for the last 6 years (that data are available from).
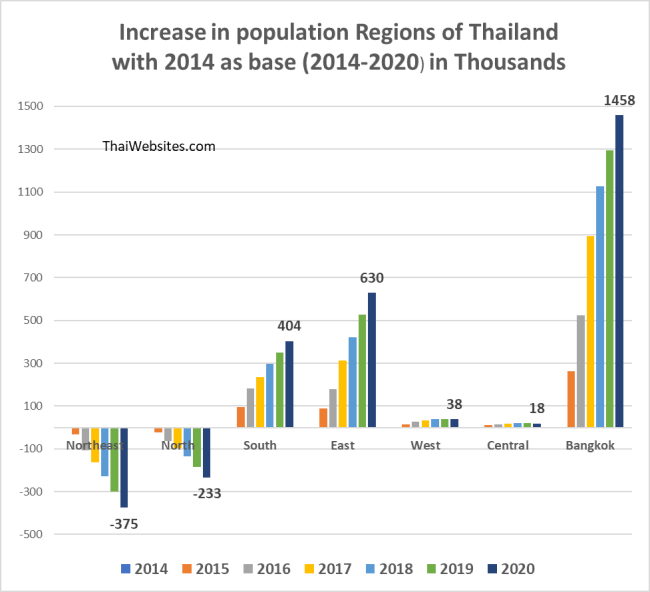
Population increase (decrease) in different Regions of Thailand (in thousands).
The migration pattern is clear. There is a steady increase in the population of Bangkok and Vicinity, the Eastern Provinces (petro and other heavy industries), and the Southern Provinces, which possibly have a different demographic pattern (Muslim population). The population of the Northeastern region is decreasing the most, by something like 60,000 persons a year on average. Interestingly, the North also sees a steady decrease in population. The changes in the Western and Central Regions are smaller, but they have a smaller population altogether.
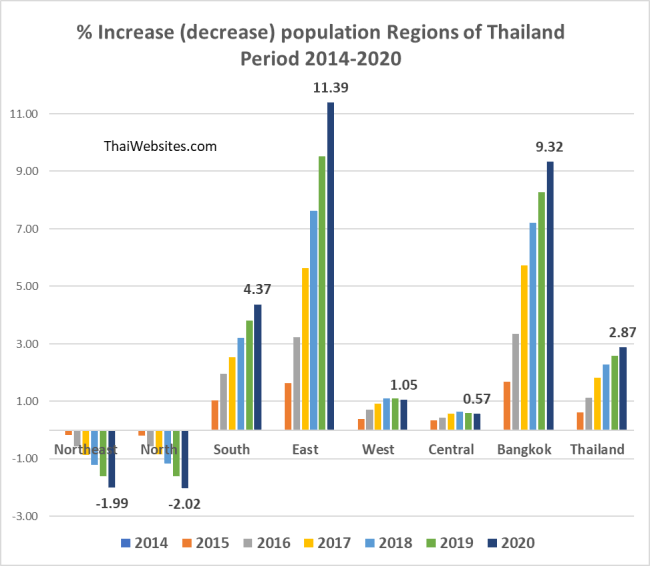
Percentage change in population in the 6 years between 2014 and 2020. The population of Bangkok and Vicinity increased by 9.32 % in these 6 years. The Eastern Provinces saw an even greater increase by 11.39 %. The Northeast and the North of Thailand see a steady decline in population by about 0.35 % per year. The overall population of Thailand is still rising at the rate of approximately 0.5 % per year. However, somewhere in the next two decades, the population will start to decline, consequence of a fertility rate that is low.
Map delineating the above described regions. You can also find the location of the provinces at our page regarding provincial GDP (GRP) :