

GDP per Capita and Population Data for the Provinces of Thailand
Updated November 2023. Last data available (predicted) for 2021.
Here are the GDP figures for 2021 (predicted values) in all the provinces of Thailand by region (latest data available at NESDC, published 2023). Numbers are Thai baht (real) in 2021.
There may be minor changes in these numbers in the following years. In a sense, recent published data always remain preliminary.
Source : Table of Gross Regional and Provincial Product 2021 (Excel file, available on website), also (to be) published.
Compared to 2019, GDP by Region in 2020 changed as follows : Bangkok and Vicinity +5.2 % : Central Region +4.6 % ; Eastern Region +7.7 % ; Northern Region -5 % ; Northeastern Region +2.3 % ; Southern Region -0.7 % ; Western Region +1.6 % ; Thailand as a Country +3.0 %. The effect of the Covid-19 Pandemic with lockdowns and international tourism restrictions, was still being felt hard, especially in the Southern Provinces, that depend heavily on tourism..
Some observations : Of the 10 provinces with the lowest per capita income, 8 are located in the North Eastern Region. In 2020 Narathiwat in Southern Thailand was the poorest province. Mae Hong Son is a Northern province among the 10 poorest provinces.
The difference in between the regions, and in between the provinces in certain regions, are simply astounding.
The predicted average GDP for the whole Kingdom of Thailand in 2021 was 231,986 Thai Baht. An increase from 225,311 Thai Baht in 2020 (+3.0%).
FYI, NESDC states that were 69,688 million Thai inhabitants (+179 thousand compared to 2020).
Population figures below are the ones estimated by NESDC for 2021. You may find slightly different numbers from other sources.
GDP per capita in 2020 for Northeastern Region.
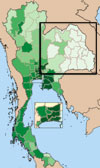
| North Eastern Region | 90,998 (+5.2%) | 18,373 (-76) |
| Province : |
GDP per capita : | Population: (thousands) |
| 1. Loei | 105,205 | 538 |
| 2. Nong Bua Lamphu | 63,568 | 472 |
| 3. Udon Thani | 90,818 | 1,253 |
| 4. Nongkhai | 97,617 | 455 |
| 5. Sakon Nakhon | 72,117 | 914 |
| 6. Nakhon Phanom | 87,122 | 548 |
| 7. Chaiyaphum | 73,134 | 926 |
| 8. Khon Kaen | 124,489 | 1,711 |
| 9. Kalasin | 77,397 | 788 |
| 10. Mukdahan | 67,203 | 422 (+) |
| 11. Maha Sarakham | 85,228 | 775 |
| 12. Roiet | 78,688 | 1,050 |
| 13. Yasothon | 70,327 | 451 |
| 14. Amnat Charoen | 77,048 | 282 |
| 15. Nakhon Ratchasima | 126,119 | 2,502 |
| 16. Buriram | 80,684 | 1,201 |
| 17. Surin | 81,675 | 1,050 |
| 18. Sisaket | 83,332 | 944 |
| 19. Ubon Ratchathani | 78,275 | 1,733 |
| 20. Bueng Kan* | 80,159* | 358* |
* The province of Bueng Kan was created in 2011. I lies adjacent to Nongkhai province and was previously part of that province. For 2021, the North Eastern Region showed a nominal growth (not inflation adjusted) of +5.2 %.
|
||
GDP per capita in 2020 for Central Region
GDP per capita in 2020 for Bangkok and Vicinity
| Central Region | 277,952 (+4.6 %) | 3,173 (-2) |
| Province : |
GDP per capita : | Population: (thousands) |
| 1. Chainat | 135,667 | 289 |
| 2. Singburi | 142,428 | 186 |
| 3. Lopburi | 142,287 | 774 |
| 4. Ang Thong | 142,287 | 246 |
| 5. Ayutthaya | 468,579 | 915(+) |
| 6. Saraburi | 323,556 | 763(+) |
| Bangkok and Vicinity | 438,760 (+0.7 %) | 17,251 (+166) |
| Province : |
GDP per capita : | Population: (thousands) |
| 7. Nakhon Pathom | 297,901 | 1,229 (+15) |
| 8. Nonthaburi | 193,641 | 1,810 (+29) |
| 9. Pathum Thani | 230,401 (-) | 1,814 (+28) |
| 10. Samut Sakhon | 391,442 | 1,076 (+11) |
| 11. Bangkok Metropolis | 593,927 | 9,034 (+35) |
| 12. Samut Prakarn | 283,160 (-) | 2,289 (+39) |
The population of Bangkok and Vicinity continues to grow, mostly migration from the Northeastern and Northern Regions of Thailand. Some provinces though had (-) growth compared to the year before.
GDP per capita in 2020
for Eastern Region
| Eastern Region | 439,875 (+7.7 %) | 6,262 (+102) |
| Province : |
GDP per capita : | Population: (thousands) |
| 1. Nakhon Nayok | 115,666 (-) | 262 (+1) |
| 2. Prachinburi | 490,499 (-) | 647 (+9) |
| 3. Sa Kaew | 73,744 | 656 (+9) |
| 4. Chachoengsao | 400,385 | 875 (+17) |
| 5. Chonburi | 524,002 | 1,926 (+35) |
| 6. Rayong | 955,119 (++) | 1,056 (+24) |
| 7. Chanthaburi | 243,317 (-) | 566 (+5) |
| 8. Trat | 160,025 | 275 (+3) |
|
||
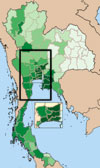
GDP per capita in 2020 for Northern Region.
| Northern Region | 111,018 (+2.3 %) | 11,273 (-51) |
| Province : |
GDP per capita : | Population: (thousands) |
| 1. Mae Hong Son | 65,653 | 241 (+2) |
| 2. Chiang Mai | 133,306 | 1,798 (-3) |
| 3. Chiang Rai | 90,203 | 1,142 (-5) |
| 4. Phayao | 96,550 | 367 (-5) |
| 5. Nan | 81.233 | 439 (-2) |
| 6. Lamphun | 226,464 (+) | 391 (-3) |
| 7. Lampang | 104,754 | 698 (-6) |
| 8. Phrae | 82,755 | 372 (-6) |
| 9. Tak | 114,952 (-) | 536 (+1) |
| 10. Sukhothai | 80,170 | 608 (-2) |
| 11. Uttaradit | 103,567 | 405 (-4) |
| 12 Kamphaengphet | 141,987 | 781 |
| 13. Phitsanulok | 113,013 | 895 (-1) |
| 14. Uthai Thani | 101,640 (+) | 274 (-2) |
| 15. Nakhon Sawan | 119,856 (-) | 912 (-8) |
| 16. Phichit | 93,950 (-) | 507 (-4) |
| 17. Phetchabun | 88,485 | 906 (-5) |
Mild improvement in GDP in 2021 compared to 2020. Population keeps on declining slowly in the Northern Provinces. |
||
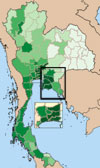
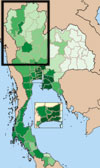
GDP per capita in 2018 for Southern Region
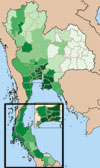
| Southern Region | 131,807 (-0.7%) | 6,695 (+75) |
| Province : |
GDP per capita : | Population: (thousands) |
| 1. Chumphon | 259,853 (+) | 501 (+1) |
| 2. Ranong | 105,256 (-) | 283 (+4) |
| 3. Surat Thani | 154,835 | 1,157 (+7) |
| 4. Phang Nga | 194,282 (-11.6 %) | 249 (-1) |
| 5. Krabi | 168,552 | 428 (+4) |
| 6. Nakhon Si Thammarat | 122,494 (+) | 1,519 (+4) |
| 7. Trang | 109,656 (+) | 632 |
| 8. Phuket | 165,343 (-26.9 %) | 602 (+7) |
| 9. Phatthalung | 81,529 (+) | 492 |
| 10. Satun | 113,481 | 297 (+2) |
| 11. Songkhla | 145,123 | 1,676 (+11) |
| 12. Pattani | 78,131 | 648 (+2) |
| 13. Yala | 105,453 | 478 (+3) |
| 14. Narathiwat | 61,787 | 733 (+4) |
A dramatic drop of GDP occurred in the Southern Region in 2020. There was not much recovery in 2021. On the contrary the provinces of Phuket and Phang Nga suffered huge decreases in GDP, related likely to disappearance of tourism. Population growth was positive, likely also related to a larger than average Muslim population in the Southern Provinces.
|
||
GDP per capita in 2020 for Western Region
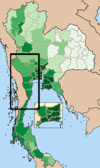
| Western Region | 156,223 (+1.6%) | 3,661 (-2) |
| Province : |
GDP per capita : | Population: (thousands) |
| 1. Kanchanaburi | 127,365 | 833 (+1) |
| 2. Suphanburi | 107,792 | 850 (-2) |
| 3. Ratchaburi | 221,383 | 811 (-1) |
| 4. Samut Songkhram | 160,089 (+) | 178 (-1) |
| 5. Phetchaburi | 144,370 | 502 (+1) |
| 6. Phrachuap Khiri Khan | 192,326 | 487 (-1) |