Traffic Accident Statistics for Thailand
See video of how to cross a busy road in Bangkok(bottom of this page).
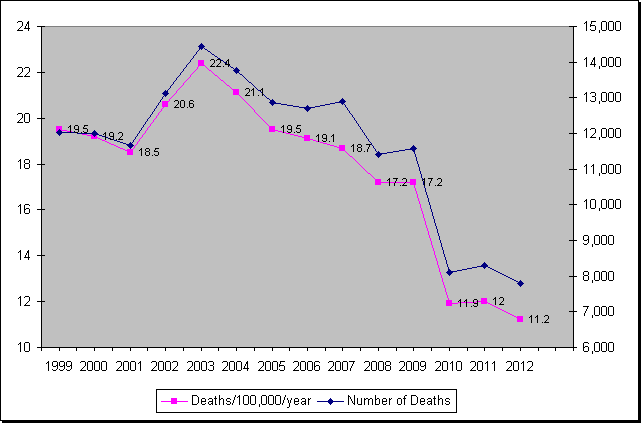
Deaths/100,000/year (an international standard for comparisons) and total actual number of deaths in Thailand, due to traffic accidents, (possibly contrary to intuition), have been declining since 2003. A prominent rather unexplained drop occurred between 2009 and 2010. If these numbers hold true (see buttom of this page), then Thailand has made great progress in reducing traffic deaths in recent years.
Year : |
Deaths/100,000/year : |
Total : |
1999 |
19.5 |
12,040 |
2000 |
19.2 |
11,988 |
2001 |
18.5 |
11,652 |
2002 |
20.6 |
13,116 |
2003 |
22.4 |
14,446 |
2004 |
21.1 |
13,766 |
2005 |
19.5 |
12,871 |
2006 |
19.1 |
12,693 |
2007* |
18.7 |
12,898 |
2008* |
17.2 |
11,422 |
2009* |
17.2 |
11,583 |
2010* |
11.9 |
8,093
|
2011* |
12 |
8,305 |
2012* |
11.2 |
7,784 |
* Since 2007, data as given by the Transport Statistics Sub-Division (Department of Land Transport) are compiled from Oct one year to Sept next year ; example 2012 means Oct 2011 till Sept 2012) |
||
When looking at the vehicles involved in traffic accidents in Thailand, the figure below indicates that the majority of accidents involve motorcycles, personal cars, pickups, and taxis, in that order. However a substantial number of trucks and buses are also involved, while pedestrians and bicyclists are likely more amongst the victims of accidents, rather than the perpetrators of damage of death.
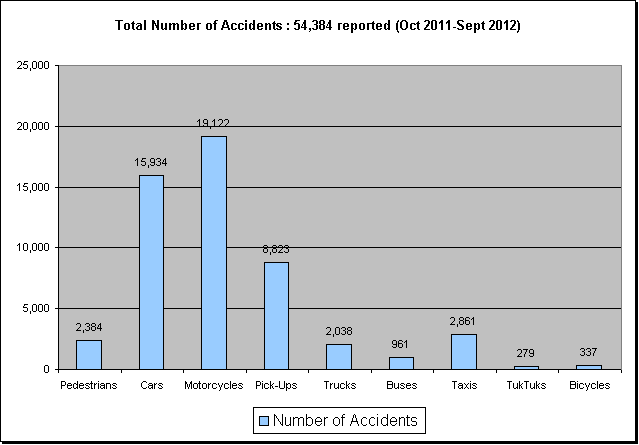
(data Oct 2011-Sept 2012)
| Number of transport vehicles in Bangkok and rest of Thailand (Dec. 2012) | ||
| Bangkok : | Rest of Thailand : | |
| Personal Cars : | 2,972,305 | 2,884,149 |
| Pick-up Trucks : | 1,089,131 | 4,348,857 |
| Motorcycles : | 2,846,690 | 16,177,061 |
Distribution of the type of vehicles in Bangkok and the rest of Thailand, explains partly the graph below.
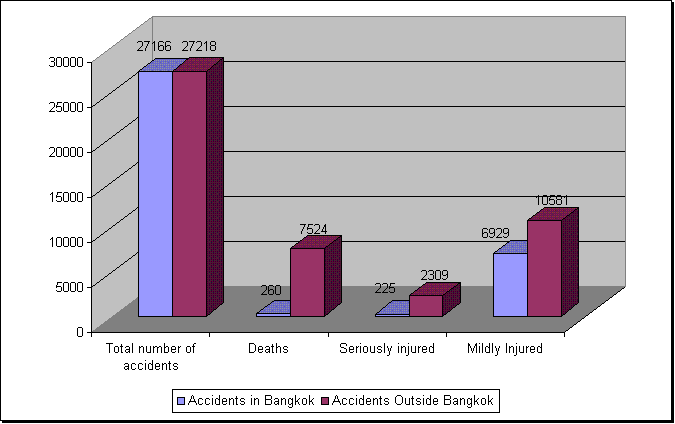
You can see that there are about the same number of traffic accidents (2012) in Bangkok and in the rest of the country all provinces combined. In Bangkok, proportionally more personal cars are involved in accidents, while in the 'countryside' pickups feature more prominently. Taking into account the number of motorcycles in Bangkok and the whole country, there are proportionally more accidents involving motorcycles in the capital.
In any case, the number of accidents in Bangkok itself when compared with the whole of the country, is rather striking. Maybe there is much more reporting of traffic accidents in the capital. After all, there is substantial pressure, each time even small accidents occur, because drivers want the streets cleared (and traffic resumed), which often necessitates police involvement.
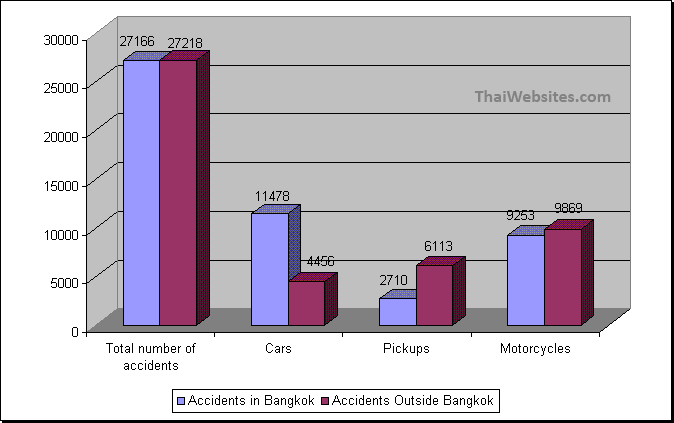
(data Oct 2011-Sept 2012)
However, the data in the column below are even more striking. While the number of accidents in Bangkok is as high as in the rest of the country, the number of deaths and serious injuries are way lower, while also the number of mildly injured persons is more moderate.
We must caution here that we are talking about reported traffic accidents, where the police department gets involved. Obviously some minor traffic accidents (and probably some accidents with only minor injuries) do not get reported and are handled by the parties involved. From data we found when researching this topic, we ascertained that the number of deaths is fairly accurate. That is when comparing police data and data collected from hospitals, the number of deaths are quite comparable. It is not so, that people killed on the road go unnoticed.
Obviously, a lot of accidents involve motorcycles. You will notice above that deaths in Europe are much lower. However, if motorcycles were taken off the road in Thailand, the number of deaths would be closer to European levels.
(data Oct 2011-Sept 2012)
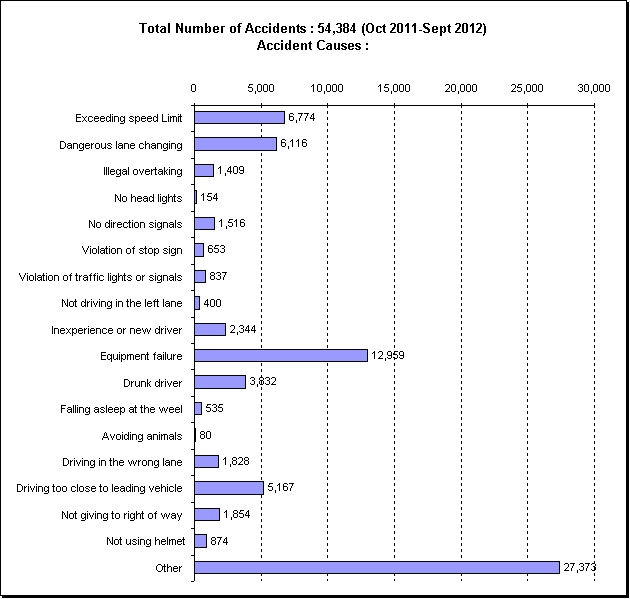
The causes of traffic accidents are also fairly well documented (see graph below). There is probably one prominent inaccuracy in the table below. There are only a limited amount of drunk drivers involved, according to the data provided by the police department. Intuitively one would assume many more accidents involve drunk drivers. One can only assume that an accident is considered to be caused by drunk driving, when it can not be categorized as caused by any of the other causes mentioned. In any case, this is a presumption, and not possible for us to clarify further.
A crackdown on drunk driving is regularly announced, suggesting that the problem is far greater than the number below indicate.
Two major underlying causes are not mentioned. One is overall behaviour of drivers on the road. Being a pedestrian, I regularly cross the zebra crossing on a major road closeby. The crossing also features traffic lights. Pedestrians have about 15 seconds to cross the road on green. Invariably cars and motorcycles just don't stop for pedestrians crossing (until a whole bunch of them is on the crossing). Car and motorcycle drivers simply do not comply with traffic regulations.
Related to this, is poor inforcement of traffic regulations. This obviously is the duty of the traffic police. Traffic police seems to be mainly preoccupied with keeping the traffic moving. Even when cars or motorcycles are blatantly breaking the rules, they often have no inclination of doing something about it. Then again, if they do stop a perpetrator, often no proper fines are imposed, but 'arrangements' are made between the driver and the police officer.
A no-tolerance policy could slowly modify driver behaviour and improve safety on the road in Bangkok and Thailand.
Add-On : Cautionary comment regarding our data.
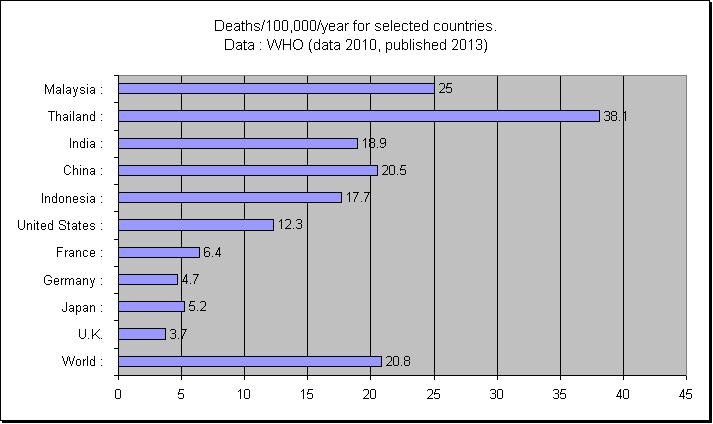
When comparing the number of fatalities due to traffic accidents, often the number of deaths is given per 100,000 inhabitants per year (deaths/100,000/year). The WHO and other organizations often divide countries into low income and high income countries, with the low income countries having almost invariably more deaths due to traffic accidents than the high income countries.
This is clearly visible in the graph above, where mostly 'poor' Asian countries are compared with U.S., rich European countries and Japan. The number for the world as a whole is also given. African countries, not mentioned here, have the highest number of casualties/100,000 inhabitants/year.
In the graph below, with data concerning 2010 (latest available at WHO), Thailand shows a deaths/100,000/year number, much higher than the ones we established above. If the number below is correct, traffic deaths in Thailand would number way above 20,000 per year.
Then again, the data from 2007 by WHO, just 3 years earlier, which we used in a previous version of this report, indicates a number of 19.6 deaths/100,000/year for Thailand, which was in accordance with local Thai records.
I asked for feedback from the WHO, regarding this issue, without reply at present.
The data used for our review, are obtained from the Transport Statistics Sub-Division
(Department of Land Transport). You will need to know how to read Thai language, and be a proficient navigator to be able to access these data. We recall that previously we also used data provided by the Police Department, but we could not find any more traffic accident reports on their website dd. February 2013.
