

Gross Domestic Product of Thailand. GDP growth rates.
Updated June 2022 with latest available data available from World Bank and NESDB of Thailand.
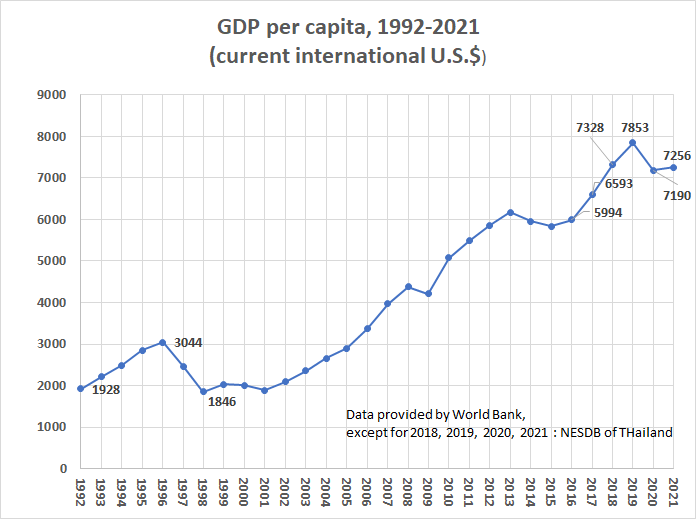
According to NESDC (Office of National Economic and Social Development Council, previously named NESDB) 2020 GDP value at current prices was 15.64 trillion Thai Baht or 501.8 billion U.S. Dollar. In 2021, GDP for Thailand was estimated at 16.18 trillion Thai Baht. This level of GDP in Thai Baht was lower than the GDP in the years 2018 and 2019, before the Covid-19 pandemic. The level is higher than in 2017 though. GDP per capita in 2020 decreased by 6.2 %, in 2021 there was an estimated growth in GDP per capita of 1.5 %. Growth remained modest at 2.6 % (estimated in 2022).
The above image shows GDP per capita in U.S. Dollar with highest value of 7,853 dollars per capita in 2019. 2020 level decreased to 7,190 U.S. Dollar and there was a modest increae to 7,256 U.S. Dollar per capita in 2021.
GDP Growth for 2020 was negative compared to 2019, at -6.1 %. This compared to negative growth of -3.5 % for the U.S.A., about -5.0 % for the Eurozone, and positive growth in China of around 2.3 %. Most countries in the region, all suffering from the effect of the Covid-19 Pandemic and the goverments's response to it, had similar growth figures as Thailand, with the clear exceptions of Taiwan (+3.0 %) and Vietnam (+2.9 %).
Generally speaking, countries that were less affected (or faster or better responding to) by Covid-19 seem to have the better GDP numbers. Since Thailand was only affected in the minor way during the initial spreading phase of the virus, it should have recovered faster than the present numbers indicate. However, things were compounded by the fact that a big chunk of Thailand's income derives from international tourism, which suffered a lot since March 2020, when for all practical purposed the borders were closed for tourist arrivals. It became only easier to travel to Thailand in 2022, with most restrictions cancelled from July 2022.
GDP growth for 2021 and 2022 were 1.5 % and 2.6 % respectively, indicating that the economy has not yet recovered from the pandemic.
The Data Below do include the numbers up to 2021. World Bank data are usually delayed by 1 or 2 years.
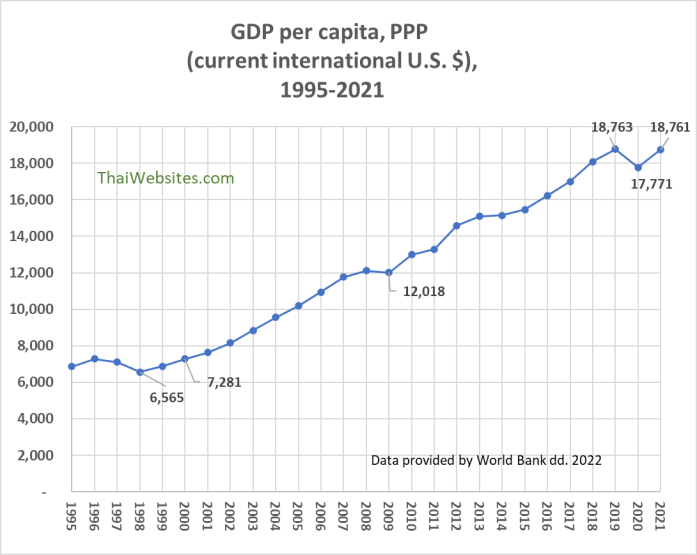
Below, the data as available also by the World Bank. PPP (purchasing power parity) method is used here, which makes for quite a difference. For 2019, GDP per Capita of 7,853 U.S. Dollar corresponds to GDP per Capita by purchasing power parity of no less than 18,763 U.S. Dollar. Simply put, a U.S. Dollar gets you much further when buying or producing goods in Thailand than in the U.S. According to its GDP by PPP method, Thailand seems to be a 'middle-income' country. As expected, during 2020 there was a decrease in GDP per capita PPP method to 17,771 U.S. Dollar. In 2021 GDP per capita (PPP) increased to 18,761 U.S. Dollar, which is approximately the same as in 2019.
Thailand GNI per Capita, as provided by World Bank, April 2023.
GDP Growth since 1980
.png)
GDP Growth in Thailand from 1985 till 2022.
Thailand Gross Domestic Product has been growing substantially over the last few decades, though not consistently. Between 1960 and the Asian crisis of 1997, GDP annual growth oscillated between 5 and around 10 percent per year.
From 1988 to 1990 there was growth substantially higher than 10 %.
The Asian economic crisis of 1997 caused a first (and substantial) drop into negative territory. Afterwards growth overall seems to trend around 5 % per year. A second dip into negative territory occurred with the global crisis of 2008-2009 with negative growth of -1.19 % in Thailand in 2009. Growth in 2010 was measured at 7.0 %, this despite significant policital disturbances.
2011 showed minor growth overall of 0.36 %, related to heavy flooding in North en Central Thailand at the end of that year. Strong rebound to 6.75 % the following year. In the following years up to now, growth was lower than generally wished for, always remaining below 5 %. In 2017 growth measured 3.67 %, in 2018 4.2 %, and in 2019 a meagre 2.3 %.
For 2020, the number stands at GDP Growth of -6.1 %. Modest increase in GDP growth of around 1.5 % for 2021 and 2.6 % for 2022.
GDP Composition by Expenditure (new data estimates for 2020, NESDC)
.png)
GDP Composition for Thailand by Expenditure for 2020 (est.) :
(*) : Exports of Goods and Services 51.8%, Imports of Goods and Services 46.8 %.
Total GDP for 2020 : 15,602 billion Thai Baht
Private Consumption : 8,304 billion Thai Baht
Government Consumption : 2,779 billion Thai Baht
Exports (+Services) : 8,076 billion Thai Baht ; Imports (+Services) : 7,302 billion Thai Baht
Gross Fixed Capital Formation : 3,621 billion Thai Baht ; Inventories
+ 125,1 billion Thai Baht
More Data : GDP data for the Regions and Provinces of Thailand